Tutorials · 7 min read
api.video Analytics helps you enhance your content strategy

Leverage api.video’s Analytics to enhance your content strategy

Take a look at the two methods you can use to retrieve data for your videos and live streams with Analytics.

api.video

July 22, 2024

Understanding your audience is key to successful video and live stream content delivery. Whether you deliver your own content, or develop a mobile app which enables creatives to deliver their own, leveraging data and analytics can help you. With api.video's Analytics solution, you gain vital insights into the viewers’ preferences and behaviors, enabling you or your users to make data-informed decisions in content creation, and engage better with the audience.


In this tutorial, we’ll go through two methods that you can use to retrieve analytics data for your videos and live streams.

What data?

The mainspring of api.video’s Analytics solution are viewer events. Metrics are generated every time a member of your audience engages with your video or live stream.


There is a wide selection of available metrics, enabling you to measure user interaction in a variety of dimensions. Metrics can help you count:


  • play: the number of times your content has been played,
  • impression: the number of times your content has been loaded and was ready for playback,
  • play-total: the total number of times a specific content has been played,
  • play-rate: the ratio that calculates the number of plays your content receives divided by its impressions,
  • start: the number of times playback was started,
  • end: the number of times playback has ended with the content watch until the end,
  • impression-time: the time in milliseconds that your content was loading for until the first video frame is displayed,
  • watch-time: the cumulative time in seconds that the user has spent watching your content.


You can define the way you want to see these metrics, using aggregations like count, total, average, and sum.


Depending on the data you are viewing, api.video’s analytics solution can help you group interaction data by these dimensions:


  • the date and time of the viewer event,
  • the ID of a specific video or live stream that generated events
  • the countries where your viewers are based,
  • the device type your viewers are using, like phone or computer
  • the browser your viewers are using, like Chrome or Firefox
  • the operating system that your users are running, like iOS or Windows
  • the tags used on a video.


api.video helps you read and filter this data, enabling you to segment and understand your audience better.

Requirements

Before we discuss the two methods, let’s talk about some requirements. api.video can only generate analytics data when you meet these simple requirements:


  1. You have already uploaded a video or are broadcasting a live streams.
  2. These videos or live streams already had viewers that create interaction events.
  3. You use the api.video player to deliver your content. You will meet this requirement when you integrate one of api.video’s Player SDKs, or embed the video or the live stream into a website, or simply share the video or live stream URL with your viewers.
analytics for content strategy

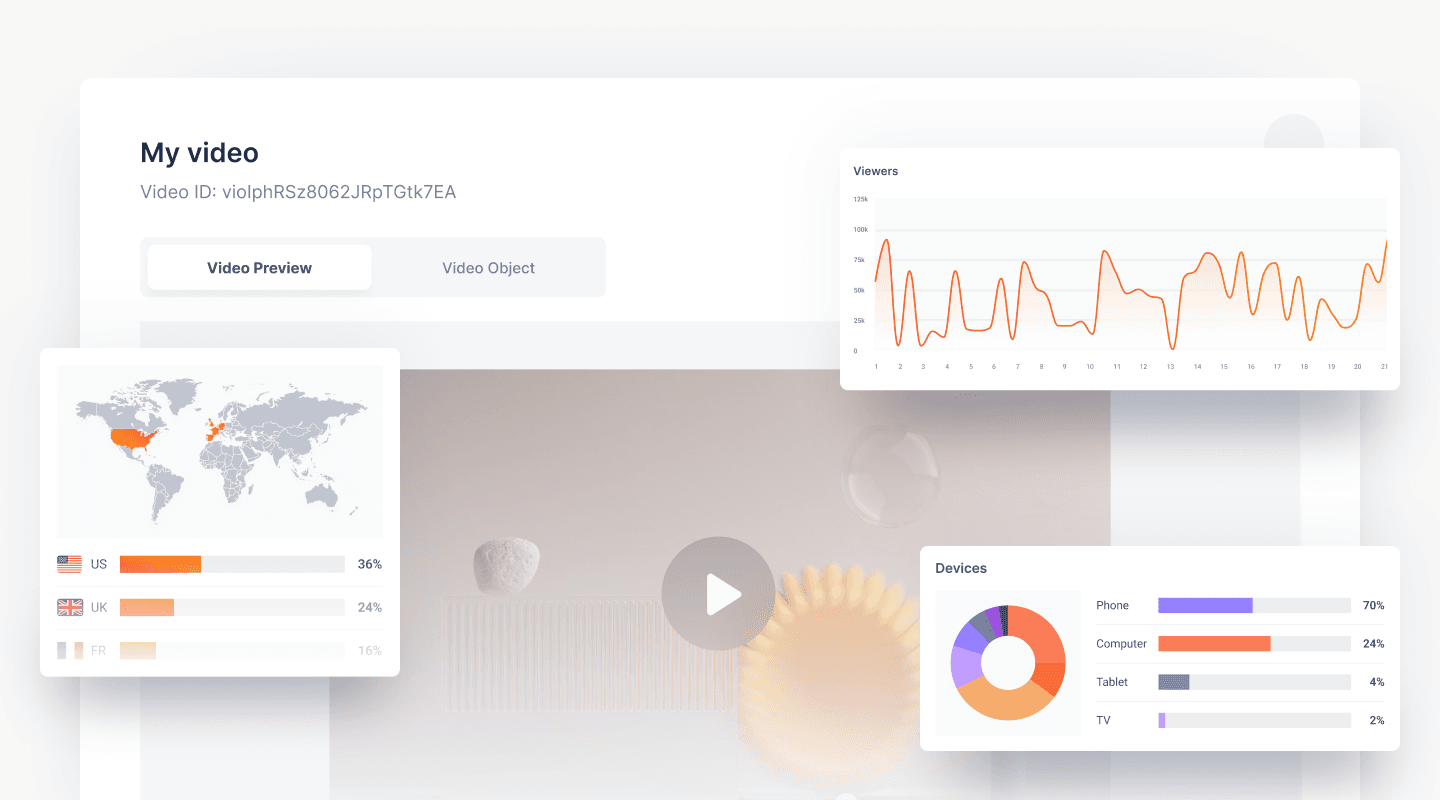
A glimpse into api.video's Analytics

You can also use a different player solution, however, you will need to integrate api.video’s analytics plug-ins, which are available for hls.js, video.js, Android, and iOS.


Once you fulfill these requirements, you’ll immediately be able to retrieve analytics using both methods discussed in this tutorial.


Note that when using api.video’s Sandbox environment, the extent of data that you can retrieve is limited to the last 24 hours.

The no-code way

By far the easiest method to get analytics for your videos and live streams is through the Analytics page in the api.video dashboard. The dashboard shows the number of play events grouped by some of the most useful dimensions that can help you answer questions like:


  • Which videos or live streams are the most popular this week?
  • What time of the day is your content most engaging?
  • Which country are most of your viewers based in?
  • Which devices, browsers, and operating systems are viewers using the most?

The integrated way

For those that prefer a more hands-on approach, we’ll dive into how you can leverage our API to retrieve analytics data and build out some typical Analytics use cases.


api.video offers 3 dedicated API endpoints that you can use to programmatically retrieve data about your content:


Visit the API reference for details about the Analytics API, including request parameters and sample responses.

1. Set up the api.video client

Let's initialize the api.video client SDK in your environment, using an example in Node.js:

javascript

2. Create a request

The client SDK will require your API key, which you can find in the dashboard. Check out the Authentication guide if you want to understand the different authentication methods you can use with api.video.


Let’s say you want to know the number of plays your French audience members have created over 5 days.


To get this data, use the /data/buckets/{metric}/{breakdown} endpoint.

javascript

Notice that we’re passing the from and to parameters to define a timeframe. We set the play metric to see the number of times your content has been played. We’re also using the country dimension, which groups data based on countries your viewers are from. We can then filter the data set using the filterBy parameter, with the specific country you are interested in: FR.


Here’s an example response payload for this request:

javascript

In the response, metricValue shows the value we wanted to see, and dimensionValue shows the country we filtered for.


Now let’s try a different approach. Maybe you updated your app to speed things up. Let's see some functional performance and retrieve the average time in milliseconds that your content was loading for until the first video frame is displayed.


To get this data, use the /data/metrics/{metric}/{aggregation} endpoint.

javascript

Again, we’re passing the from and to parameters to define a timeframe. One month should be enough. We set the impression-time metric to see the load times, with the average aggregation.


Here’s an example response payload for this request:

javascript

Check out the complete list of dimensions and example response payloads for both success and error cases in the API reference.

3. How to use this data?

When building an application or website where you serve videos or live streams, you can find some creative ways to leverage analytics data:


  • Create data visualizations for your users. This could include graphs and charts showing views over time, peak viewing periods, or geographic distribution of the audience.
  • Localize Content. Use geographic data from play events to tailor content to specific regions, accommodating regional preferences or languages.
  • Create recommendations. Find the most popular, or even the least popular videos and show them as recommended videos for your viewers.

Conclusion

With api.video’s Analytics solution, you're not only delivering content; you're unlocking a world of data that helps you connect more meaningfully with your audience. Whether you're aiming to expand your reach, tailor content to specific regions, or simply understand your audience better, api.video’s Analytics is your gateway to smarter content strategy.


To start using api.video and see how this works, sign-up for a free sandbox account now.

Try out more than 80 features for free

Access all the features for as long as you need.
No commitment or credit card required

Video API, simplified

Fully customizable API to manage everything video. From encoding to delivery, in minutes.

Built for Speed

The fastest video encoding platform. Serve your users globally with 140+ points of presence. 

Let end-users upload videos

Finally, an API that allows your end-users to upload videos and start live streams in a few clicks.

Affordable

Volume discounts and usage-based pricing to ensure you don’t exceed your budget.