Tutorials · 13 min read

Using analytics to analyze where to edit a video
Learn how to use some simple pandas commands and analytics visualization tools to figure out where a video could be edited or improved upon.
Erikka Innes
April 19, 2021
Video analytics can tell you a lot about how people are watching your video, especially if you decide to dig into player sessions. With api.video's analytics endpoint you can figure out details like where people fast forward, or rewind your video. This information can be used to help you determine things like:
- Whether something is confusing or boring
- Whether something is interesting or entertaining
...and more!
For this article, I decided to pull analytics for a popular api.video demo called Upload a video to Discord.
Pull Analytics Data for a Video
If you know what video you want to pull analytics for, it's pretty easy to grab this information:
- Open your dashboard by clicking Login on the api.video homepage and logging in if you are not logged in to api.video.
- Navigate to your dashboard.
- Click on the video you want analytics data for.
- On the video's page, there's a copy link section that will contain a video link. It will look something like:
https://embed.api.video/vod/vi5PBib80QrC8q73AekJqNDH. Get the videoId, which is the part that comes after vod/.
NOTE: You could also collect this information programmatically. To do that, you'd send a request to the videos endpoint. You'd look through the list returned, pull the videoId for the one you wanted, and continue on.
- After you have your videoId, you're going to want to retrieve an exhaustive list of player sessions for your video. The code for that is:
python
For our data file, for each row we list the sessionID, what type of action was taken, when the session with the video first started (emitted at), and then three columns - at, from, and to. Some of the action types don't use some of these last three columns.
Get Familiar with Your Data
Now that you have your csv file containing all the sessions for the video you selected, it's time to start thinking about how to analyze it. You can see a lot of interesting information:
- pause - when someone pauses a video
- resume - when someone resumes a video
- ready - when the video is at the start position
- play - when someone starts the video
- end - when someone watches to the end of the video
- seek.backward - when the video winds backward
- seek.forward - when the video winds forward
In our table, a sample row for each will look like:
pause
-sessionID-, pause, 2021-02-25T09:57:14+00:00, 45, not, not
What we can see from this sample row, is that someone paused their video 45 seconds in. If the row right after pause isn't resume, we can check if the sessionID is different. If it is, we can be sure that whoever was watching the video, stopped watching at 45 seconds. Who would do such a thing? There's an extra 5 seconds of video after that! As it turns out, if you watch the video here: https://a.video/works/upload-a-video-to-discord you can see that by 45 seconds, Doug successfully completed the task he's teaching with the demo. The video runs on Discord. If you were satisfied with the demo, you might pause the video and then leave, or close the tab (which would count as a pause to api.video's analytics).
resume
-sessionID-, resume, 2021-02-25T18:10:28+00:00, 25, not, not
The resume action will usually occur right after pause, or after a seek.forward or seek.backward action. This action is anytime the video is stopped, and you press play. If your video is at the very start, clicking play doesn't register as a resume.
ready
-sessionID-, ready, 2021-02-25T14:48:49+00:00, 0, not, not
Ready appears when you open the video and you haven't started playing it yet. If you see ready and then you see a different sessionID, you know the user reached the video, then decided for some reason not to play it. You will need other contextual data to guess why that might be.
play
-sessionID-, play, 2021-02-25T18:10:20+00:00, 0, not, not
The play action occurs at the start of the video, when the user presses play. This can be a useful event to check for since if you don't find it in a session, you can be sure the user didn't start the video.
end
-sessionID-, end, 2021-02-27T17:30:18+00:00, 50, not, not
The end action indicates that the user watched the video to the very end. This can be useful if you want to filter through sessions to see what percentage of sessions reach the very end of the video.
seek.backward
-sessionID-, seek.backward, 2021-02-27T14:53:02+00:00, not, 35, 29
Something to watch for is where users wind back. If you're teaching them something, they might be winding back because they don't understand a concept, or they can't clearly see something in the video. They could also wind something back because it's interesting, or they weren't paying attention and need to rewatch it.
seek.forward
-sessionID-, seek.forward, 2021-02-26T09:52:56+00:00, not, 29, 38
Seeking forward can mean a lot of things. If you've made an instructional video, a user could seek forward to surf through the video and see if they can find the information they need more quickly. They could seek forward because a concept was well explained, and they're ready for the next concept or step. It could also be because they feel bored. It will depend on the video and your analysis of the content vs. the behavior.
Grooming the Data
To do find patterns in your data, you can start trying to filter it to see if you find something. Here's a few ideas I started with:
- See if there's anything repetitive that stands out when I scroll through the csv that gives me ideas.
- See if there's anything weird that stands out.
NOTE: Obviously looking at a table of data when there's tons of entries isn't the best way to review your information. It's a starting point that acquaints you with what it looks like and what you have. You should always make sure to come up with questions to investigate where you can filter content to answer them or visualize your content.
- Come up with ways to filter things that might display a pattern. This would be where you ask questions like, how often do people seek backwards or forwards? What do they seek backwards and forwards across the most?
- Come up with ways to count things that might yield interesting information. For example, how many sessions are there where people watch the video all the way to the end?
Browsing the Data
As luck would have it, when I started browsing the data I did notice something I thought was odd. There were a lot of instances where it looked like a user wound the video back from the very end to the very beginning. The lines of data looked something like this:
-sessionID-, seek.backward, 2021-02-28T15:49:44+00:00, not, 50, 0
Why, I wondered, would a user want to rewind all the way to the beginning? Examining the data, I noticed something else- the seek.backward like this happened after the end event in the same session.
-sessionID-, end, 2021-02-28T15:48:42+00:00, 50, not, not
I checked and discovered the player for this project is set on loop. I didn't know before, but now know that if your player is looping, the loop is shown as two events - first, end. Second, seek.backward to 0. Instances where I found this in the data were spots where someone left the video running and it just looped around again.
Filtering the Data
To filter the data, I decided to start with an easy question. Out of the total number of sessions I pulled, how many sessions did a user watch the video all the way to the end?
NOTE: You need to have pandas installed in your Python environment.
python
Here's what I got back:
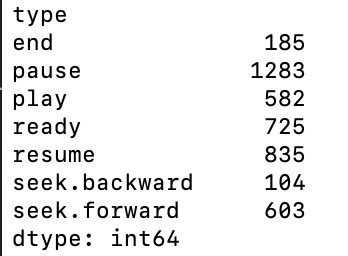
From this data, we get answers to questions I have not asked yet! Starting with the first question, what percentage of users watch all the way to the end? To answer this, we must figure out how many sessions we have total. That's easy - we know that 'ready' only occurs once per session, and indicates that a video is ready to be played. From our chart, we can see we have 725 instances of ready. So that means
Answer: 25.5% of users! That's great. Especially because in an instructional video, people often learn the concept, and leave immediately. The end of this video is an interesting shot of bells chiming in a church, which 25% of viewers liked enough to stay for, even though it could be argued that you learn everything you need about this demo by about the 42 second mark - where you see the video successfully play on Discord. I would interpret this statistic as an indication that the content is educational and entertaining.
We also learn something that might seem a little strange, we have 725 sessions, but of those 725 sessions, people only played the video 582 times. That means about 80.28% of users watch the video, but about 19.72% don't. That might seem weird - who goes to a page to see a demo then says nope nevermind? A possible answer lies in the page the video is shown on. Here's an image for you:
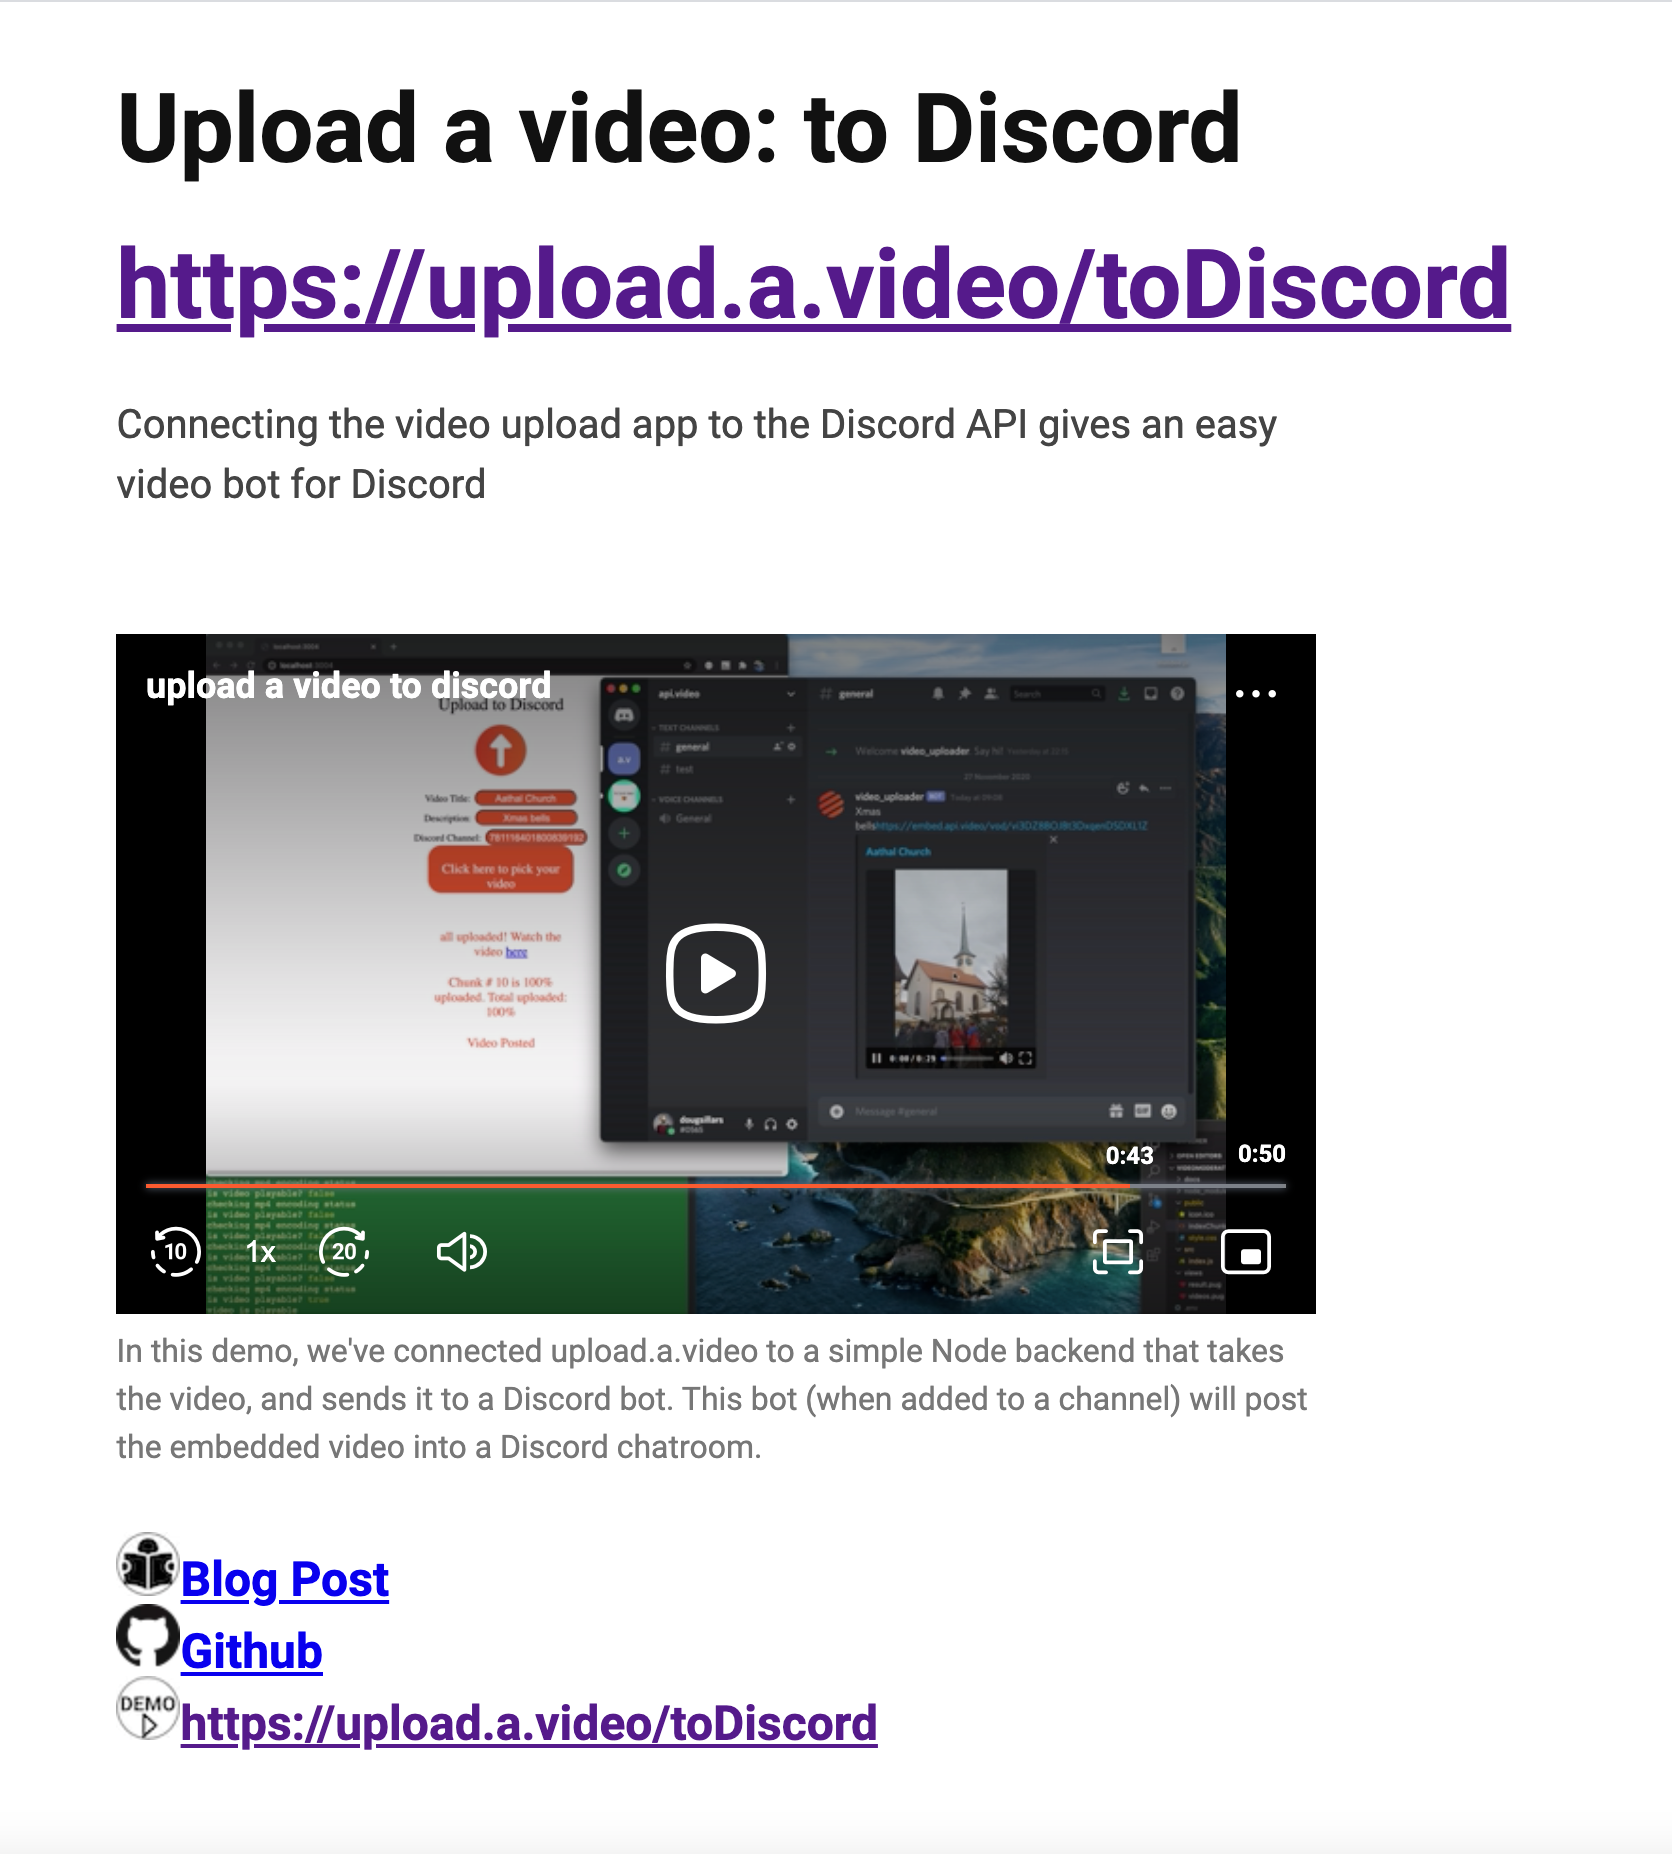
So we can see the video here, but check out the choices we offer below the video - Blog Post and Github. As you may know, some developers don't want to read blog posts or watch videos. They just want a code sample. So a possibility is they come here for the demo, then they see we offer the code, decide that's what they prefer, and away they go!
What I could maybe be looking at here is the answer to the question 'What percentage of developers prefer a code sample to a written tutorial or demo?' (specifically for our company, don't quote me on this one). I could pull more of api.video's demo analytics and see if the percentage stays consistent across the demos. With a tool like HotJar, I could figure out if we have a lot of users that immediately click on that GitHub link or not, and start building a case for my hypothesis, or disproving it.
Because we're creating educational content, I could maybe use the ~20% statistic to make a case for always including code samples for our demos on github. You could use this information other ways too. If your video was a movie or a short film for example, you might want more people to watch the video than 80%. Maybe it would lead you to test other page designs, or changing the thumbnail for your video to make it more interesting to everyone.
Okay well this was fun. Let's try some more filtering and a little bit of visualizing.
Visualizing the Data
There are lots of ways to visualize your data. For this post, I decided to keep it simple, and use a graph you can create with plotly. But before we get to the tools, how about the question? I decided to plot all instances where somebody is seeking forward or backward.
For my first try, I thought, why not use the index to plot each instance of winding forward and backward, and I'll use colors. I narrowed my data down to just rows that contained seek.forward or seek.backward. Here was my code:
python
In the sample, I take all the master file with all my sessions for this video, and then I choose only rows that contain seek in the type. I output this into a new file 'discord_seek_sessions.csv'.
Now it's time to try making some kind of chart. I went with something simple. I thought maybe I can use the index to represent separate events. Each event gets its own index marker. It came out like this:

There's a lot going on. There's so many entries, they scroll off the top and bottom right side of the page. If it's not clear, the legend on the right represents the time interval in seconds someone used seek.forward or seek.backward. The line represents the color that will be displayed in the graph. On the graph, across the bottom you can see the time in seconds. Up the left side, is the index that went with the event displayed.
Let's make this better. The first thing I tried, was regrouping everything. I gave a unique index to anything with the same session ID and seek direction. That way each session would have two bands where you could see the lines. It didn't improve the chart's clarity, but the code for it is neat and will help us later, so I'm going to share that for you here:
python
If you ever need to assign an index value based on a group, this code will help you! But it didn't help with our situation. That led me to the next idea, what if I split the sessions into separate dataframes? or csv files, depending on how you prefer to do things?
This yielded a bit more clarity. Also I chose to put the data into separate csv files, this is the code for that:
python
Checking out the different files in my chart, I used the groupby trick I just told you about. Because there is only one type of action per chart, it places every instance of a particular seeking action on one line. A little less busy, but not a big improvement.
The next thing I thought of was going back and counting how popular it was to wind either forward or backward at any point in the video. The code for that is pretty simple, and I decided to use it for winding forward:
python
Now it's getting interesting. What if I make a chart of the most popular place to forward.seek from? It looks like it's about 33 seconds into the video. (See?)
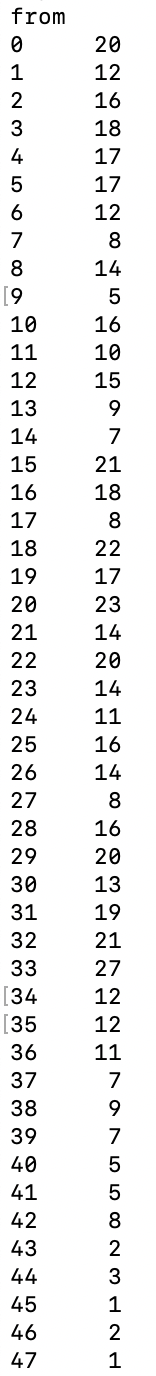
Let's make the chart now! We can reuse some code from earlier, and filter for instances when from = 33.
python
The sample shows us the following:
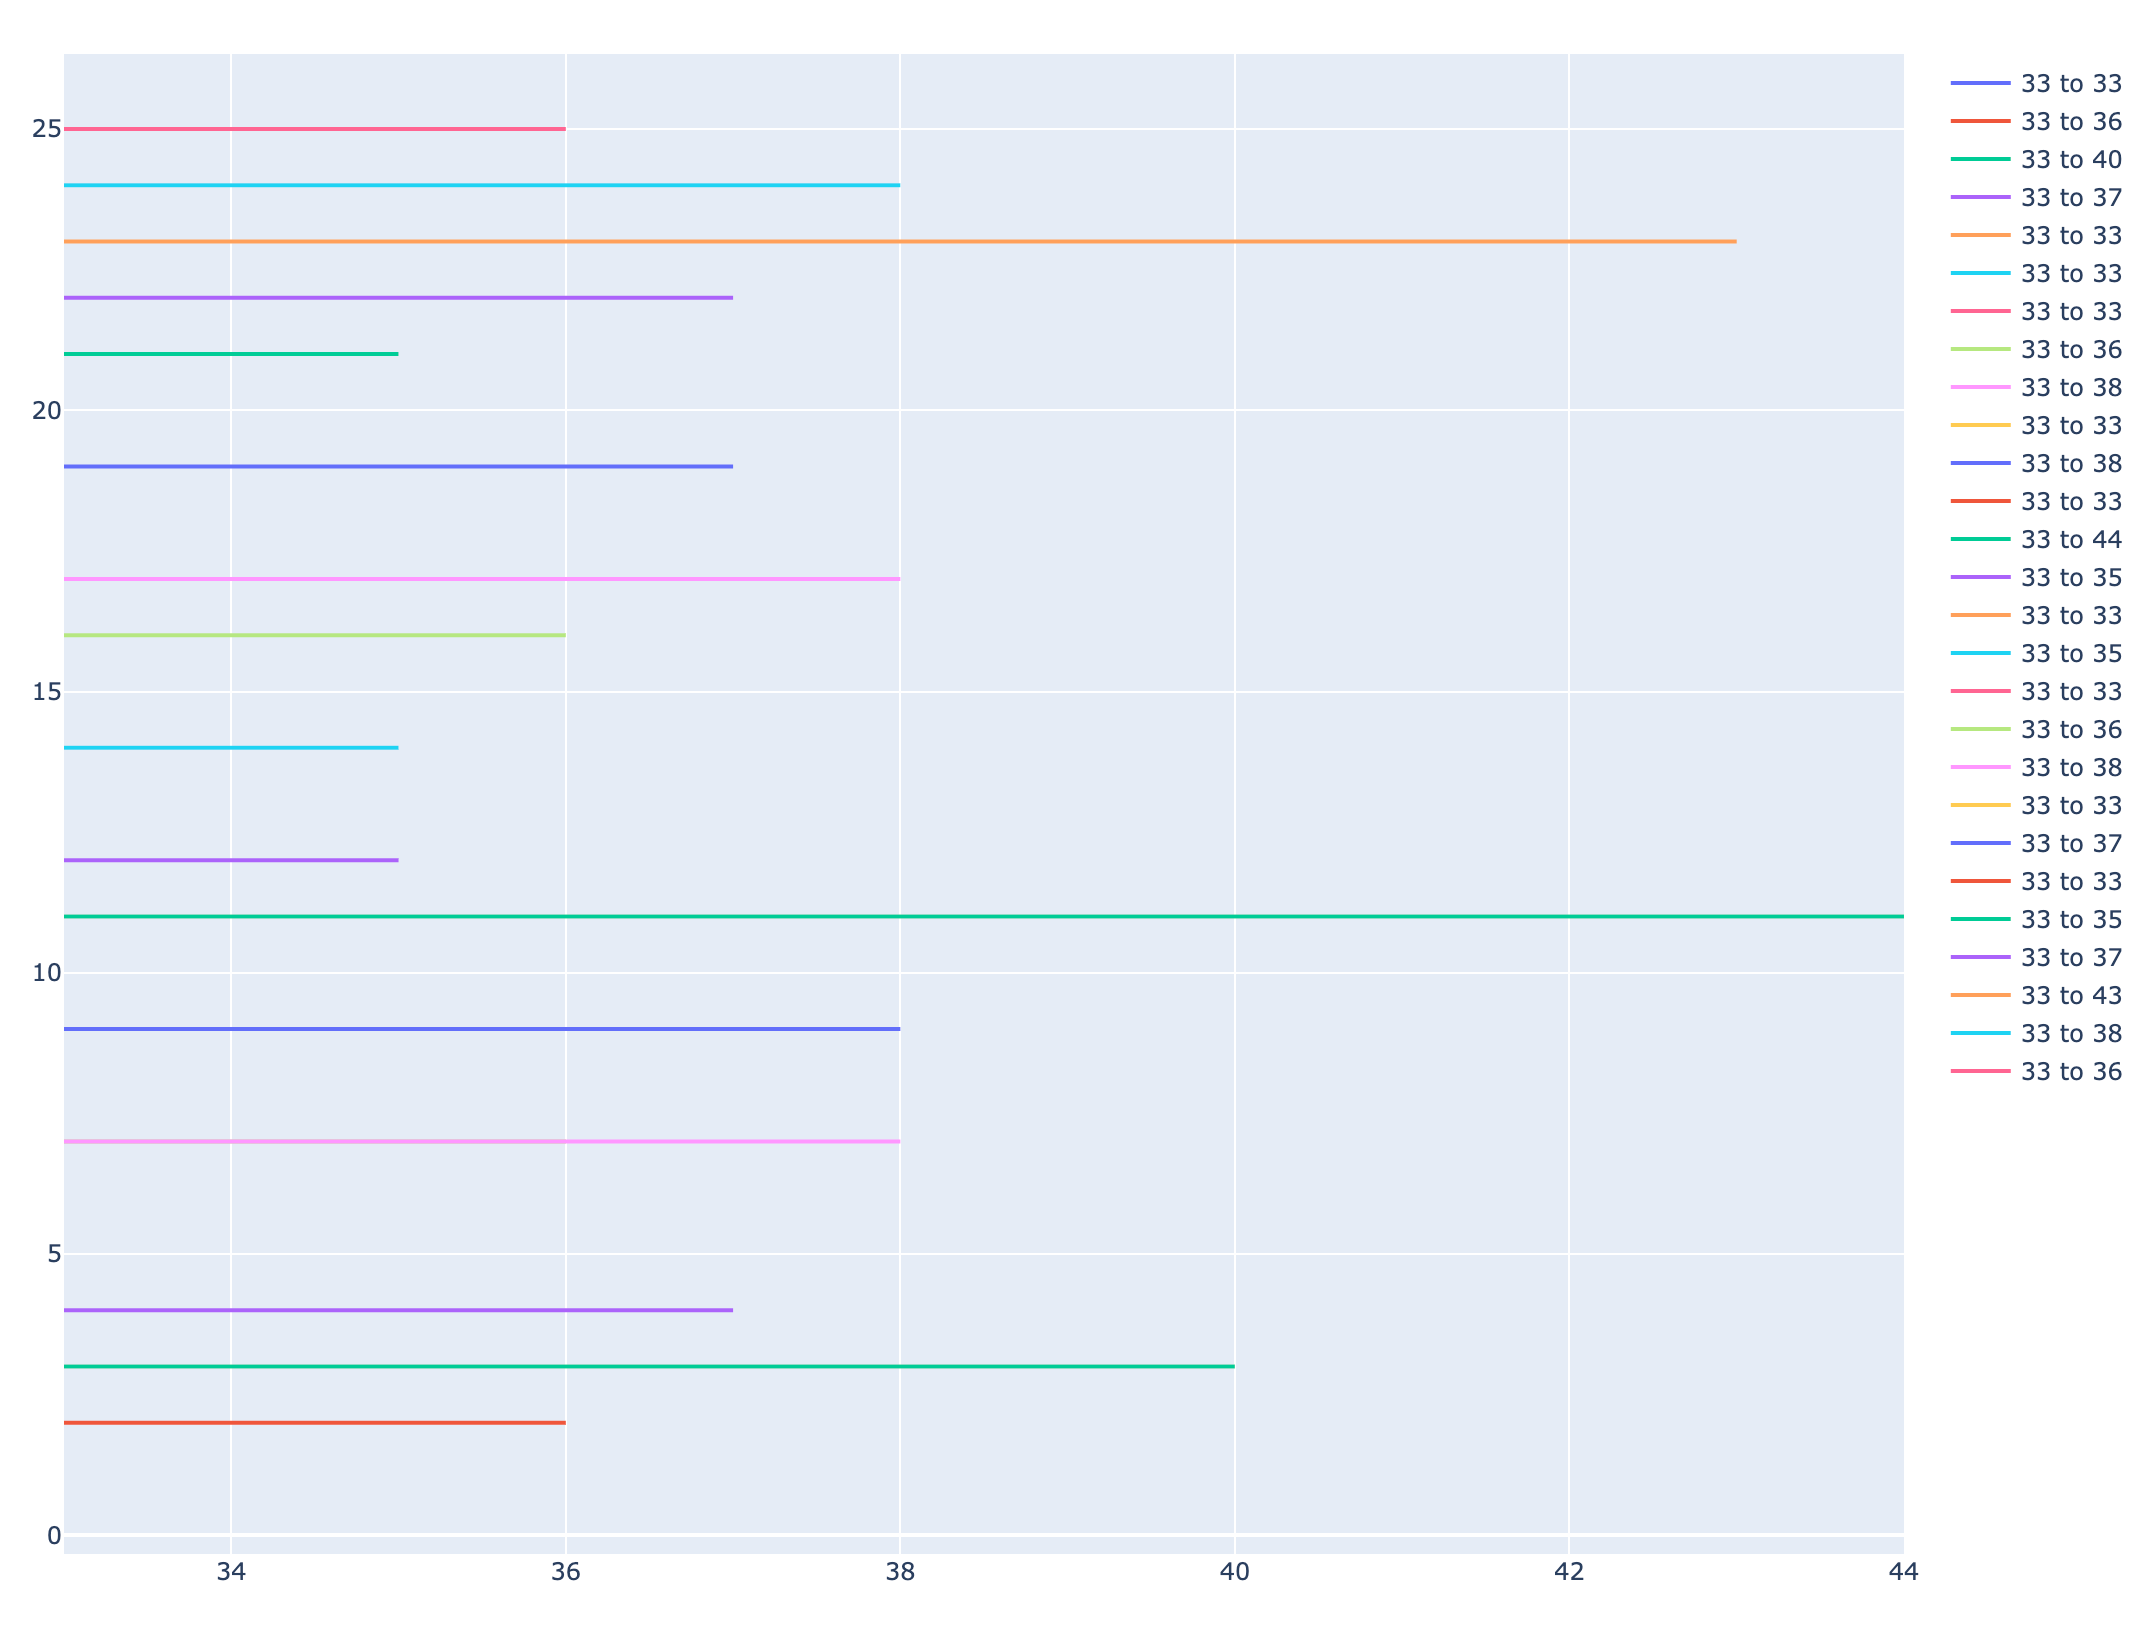
Why is seeking forward so popular here? If you watch the video, you'll note that this is the part where Doug walks through using Discord. If you are using the tutorial because you like Discord, it's possible some users are really familiar with Discord already. So during this section, they seek forward to find out what comes next. When it gets to where the video plays, 25% watch the video, everyone else says aha! I've learned how to do this now I will go implement what I've learned etc.
You can repeat this process with other areas in your video. For example, in this video, there's high seek forward rates from around 15 seconds through to 22 seconds. In the video, this is the part where you wait for an upload to complete. If you were trying to optimize the video or edit it, you might make a case that part of this section could be edited out.
While we're applying this to an educational demo, you could easily apply this kind of simple research to short films and movies. Find out where people fast forward to learn if a section of the film isn't working the way you planned. If someone keeps winding a section back to rewatch it, maybe it's because it's an incredible scene, and you can make sure to do more things a similar way in the future.
Hope this was a fun start to analyzing your content! See you next time.
YOU MIGHT ALSO LIKE
LATEST ARTICLES

Tutorials · 8 min read
What is a webhook and how to use webhooks for real-time video management
Answer critical questions like what are webhooks, how they work, and how you can use them for video management.
api.video · September 12, 2024
Tutorials · 4 min read
How to build AI facial expression detection into your videos with React
Learn how to add AI facial expression detection to your videos using one of Javascript's powerful libraries, React.
Yohann Martzolff · June 26, 2024
Tutorials · 4 min read
How to integrate AI facial expression detection to control your video – Javascript
Learn how to add AI facial expression detection to your videos using Javascript.
Yohann Martzolff · June 25, 2024
Try out more than 80 features for free
Access all the features for as long as you need.
No commitment or credit card required
Video API, simplified
Fully customizable API to manage everything video. From encoding to delivery, in minutes.
Video API, simplified
Fully customizable API to manage everything video. From encoding to delivery, in minutes.
Built for Speed
The fastest video encoding platform. Serve your users globally with 140+ points of presence.
Built for Speed
The fastest video encoding platform. Serve your users globally with 140+ points of presence.
Let end-users upload videos
Finally, an API that allows your end-users to upload videos and start live streams in a few clicks.
Let end-users upload videos
Finally, an API that allows your end-users to upload videos and start live streams in a few clicks.
Affordable
Volume discounts and usage-based pricing to ensure you don’t exceed your budget.
Affordable
Volume discounts and usage-based pricing to ensure you don’t exceed your budget.