Video trends · 4 min read
How we use Analytics in-house

How we use Analytics at api.video to optimize our video content — and you can too!

Learn practical tips and techniques to optimize your own video content with Analytics as we share the approach we use in-house.

Arushi Gupta,

Sebastian Marin

October 18, 2024

We know our Analytics feature is a game-changer, and you're probably already using it in all kinds of creative ways. Today, we thought we'll flip the script and show you how we use Analytics right here at api.video.


In this blog, we will spill the beans on how we use Analytics to closely look at the performance of our video content. And guess what? You can take these tricks and use them to level up your own video game too.


Let’s dive in.

Tracking 'plays' to measure engagement

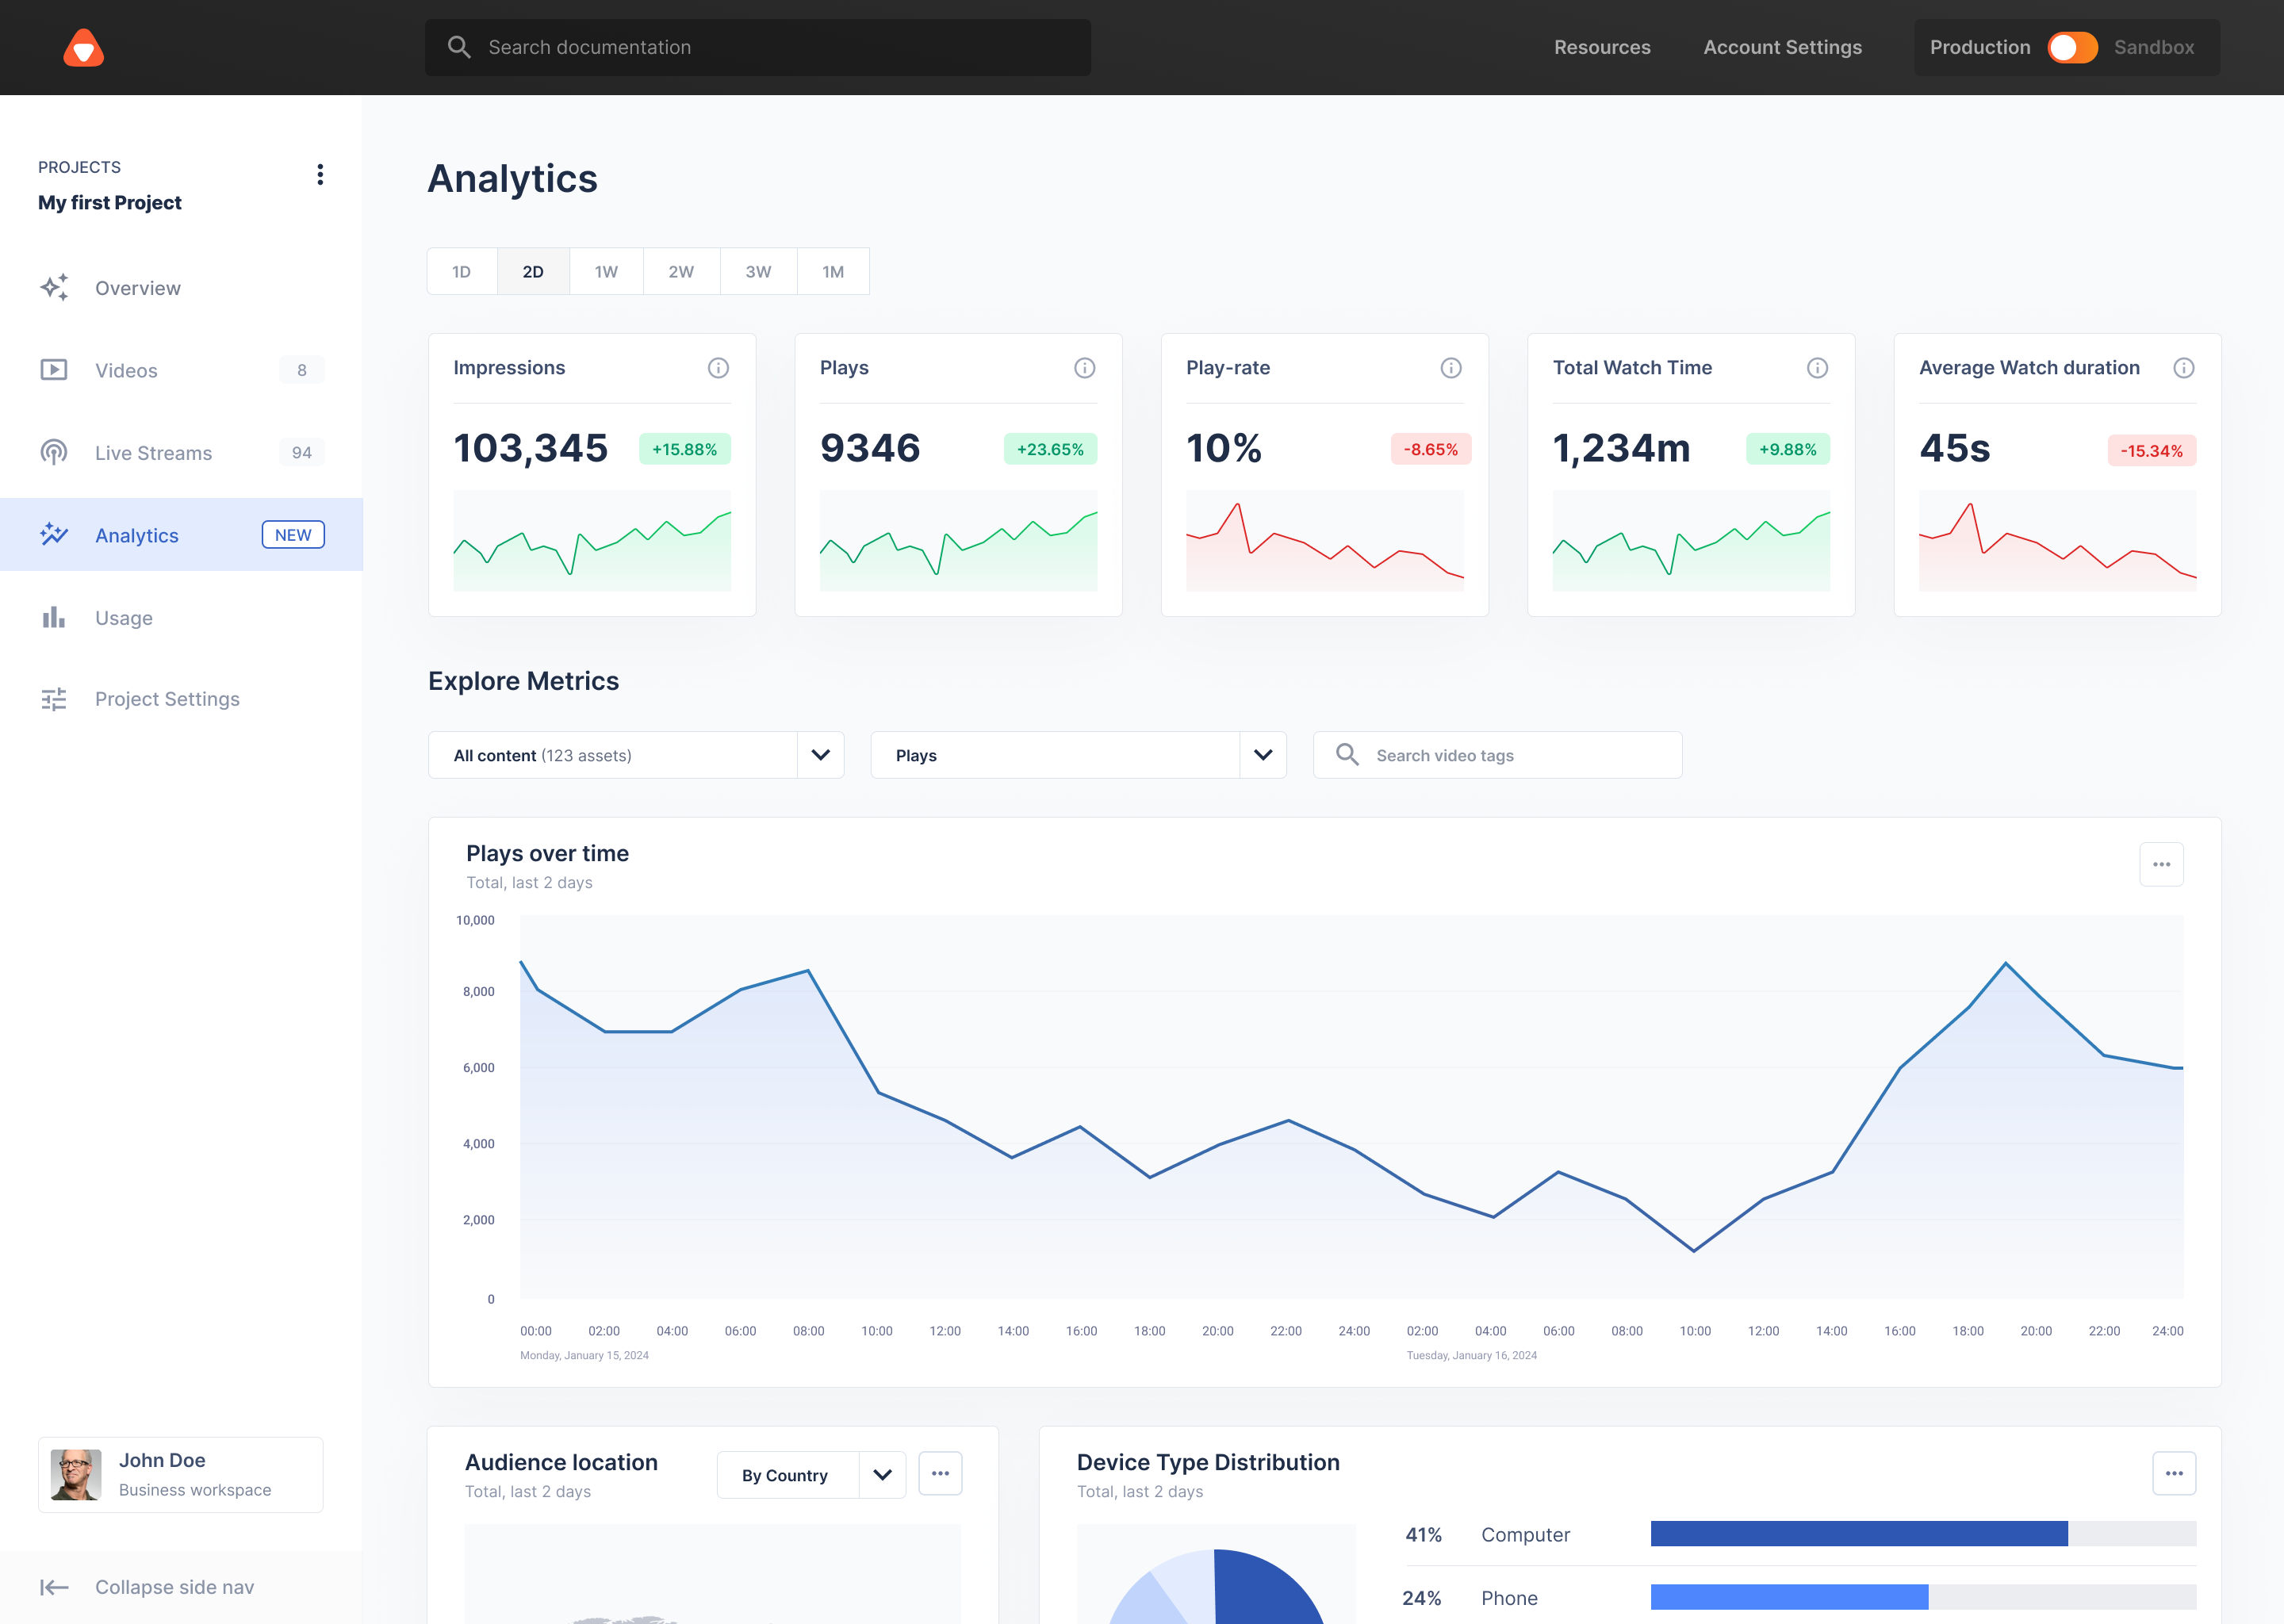
One of the most fundamental metrics in video Analytics is tracking 'plays'. 'Plays' shows the number of times a user clicked on the player to view the video. This metric provides a clear picture of how often videos hosted on your api.video account are being watched. We use this data to evaluate how our content is performing and make sure it aligns with our strategic goals.


In the api.video dashboard, you can easily track the plays for specific videos by searching with the video ID or title, filtering by time frames, and even checking impressions and view duration. If you’re a developer, these metrics are also accessible through our API using specific calls with the plays metric, making it even easier to automate your analysis.

A glimpse of the Analytics tab on the dashboard

A glimpse of the Analytics tab on the dashboard

Analyzing 'play-rate' to optimize engagement

When it comes to making your video content more engaging, the 'play-rate' metric becomes very important. This metric compares the number of 'impressions' (how many times the video player was loaded) to the number of 'plays' (how many times the video was actually clicked).


At api.video, we use this data to experiment with various combinations of titles, thumbnails, and video players to see what resonates most with our audience. After analysing the play rate of our videos, we’ve realized that with visually appealing and precise thumbnails, our developer-centric viewers are more likely to click on and engage with our videos.


You can do the same to boost engagement on your own platform. Use this data to fine-tune the elements that influence viewer decisions.

Sign up and see how Analytics is a gamechanger for your videos

Understanding viewer retention with 'start & end' metrics

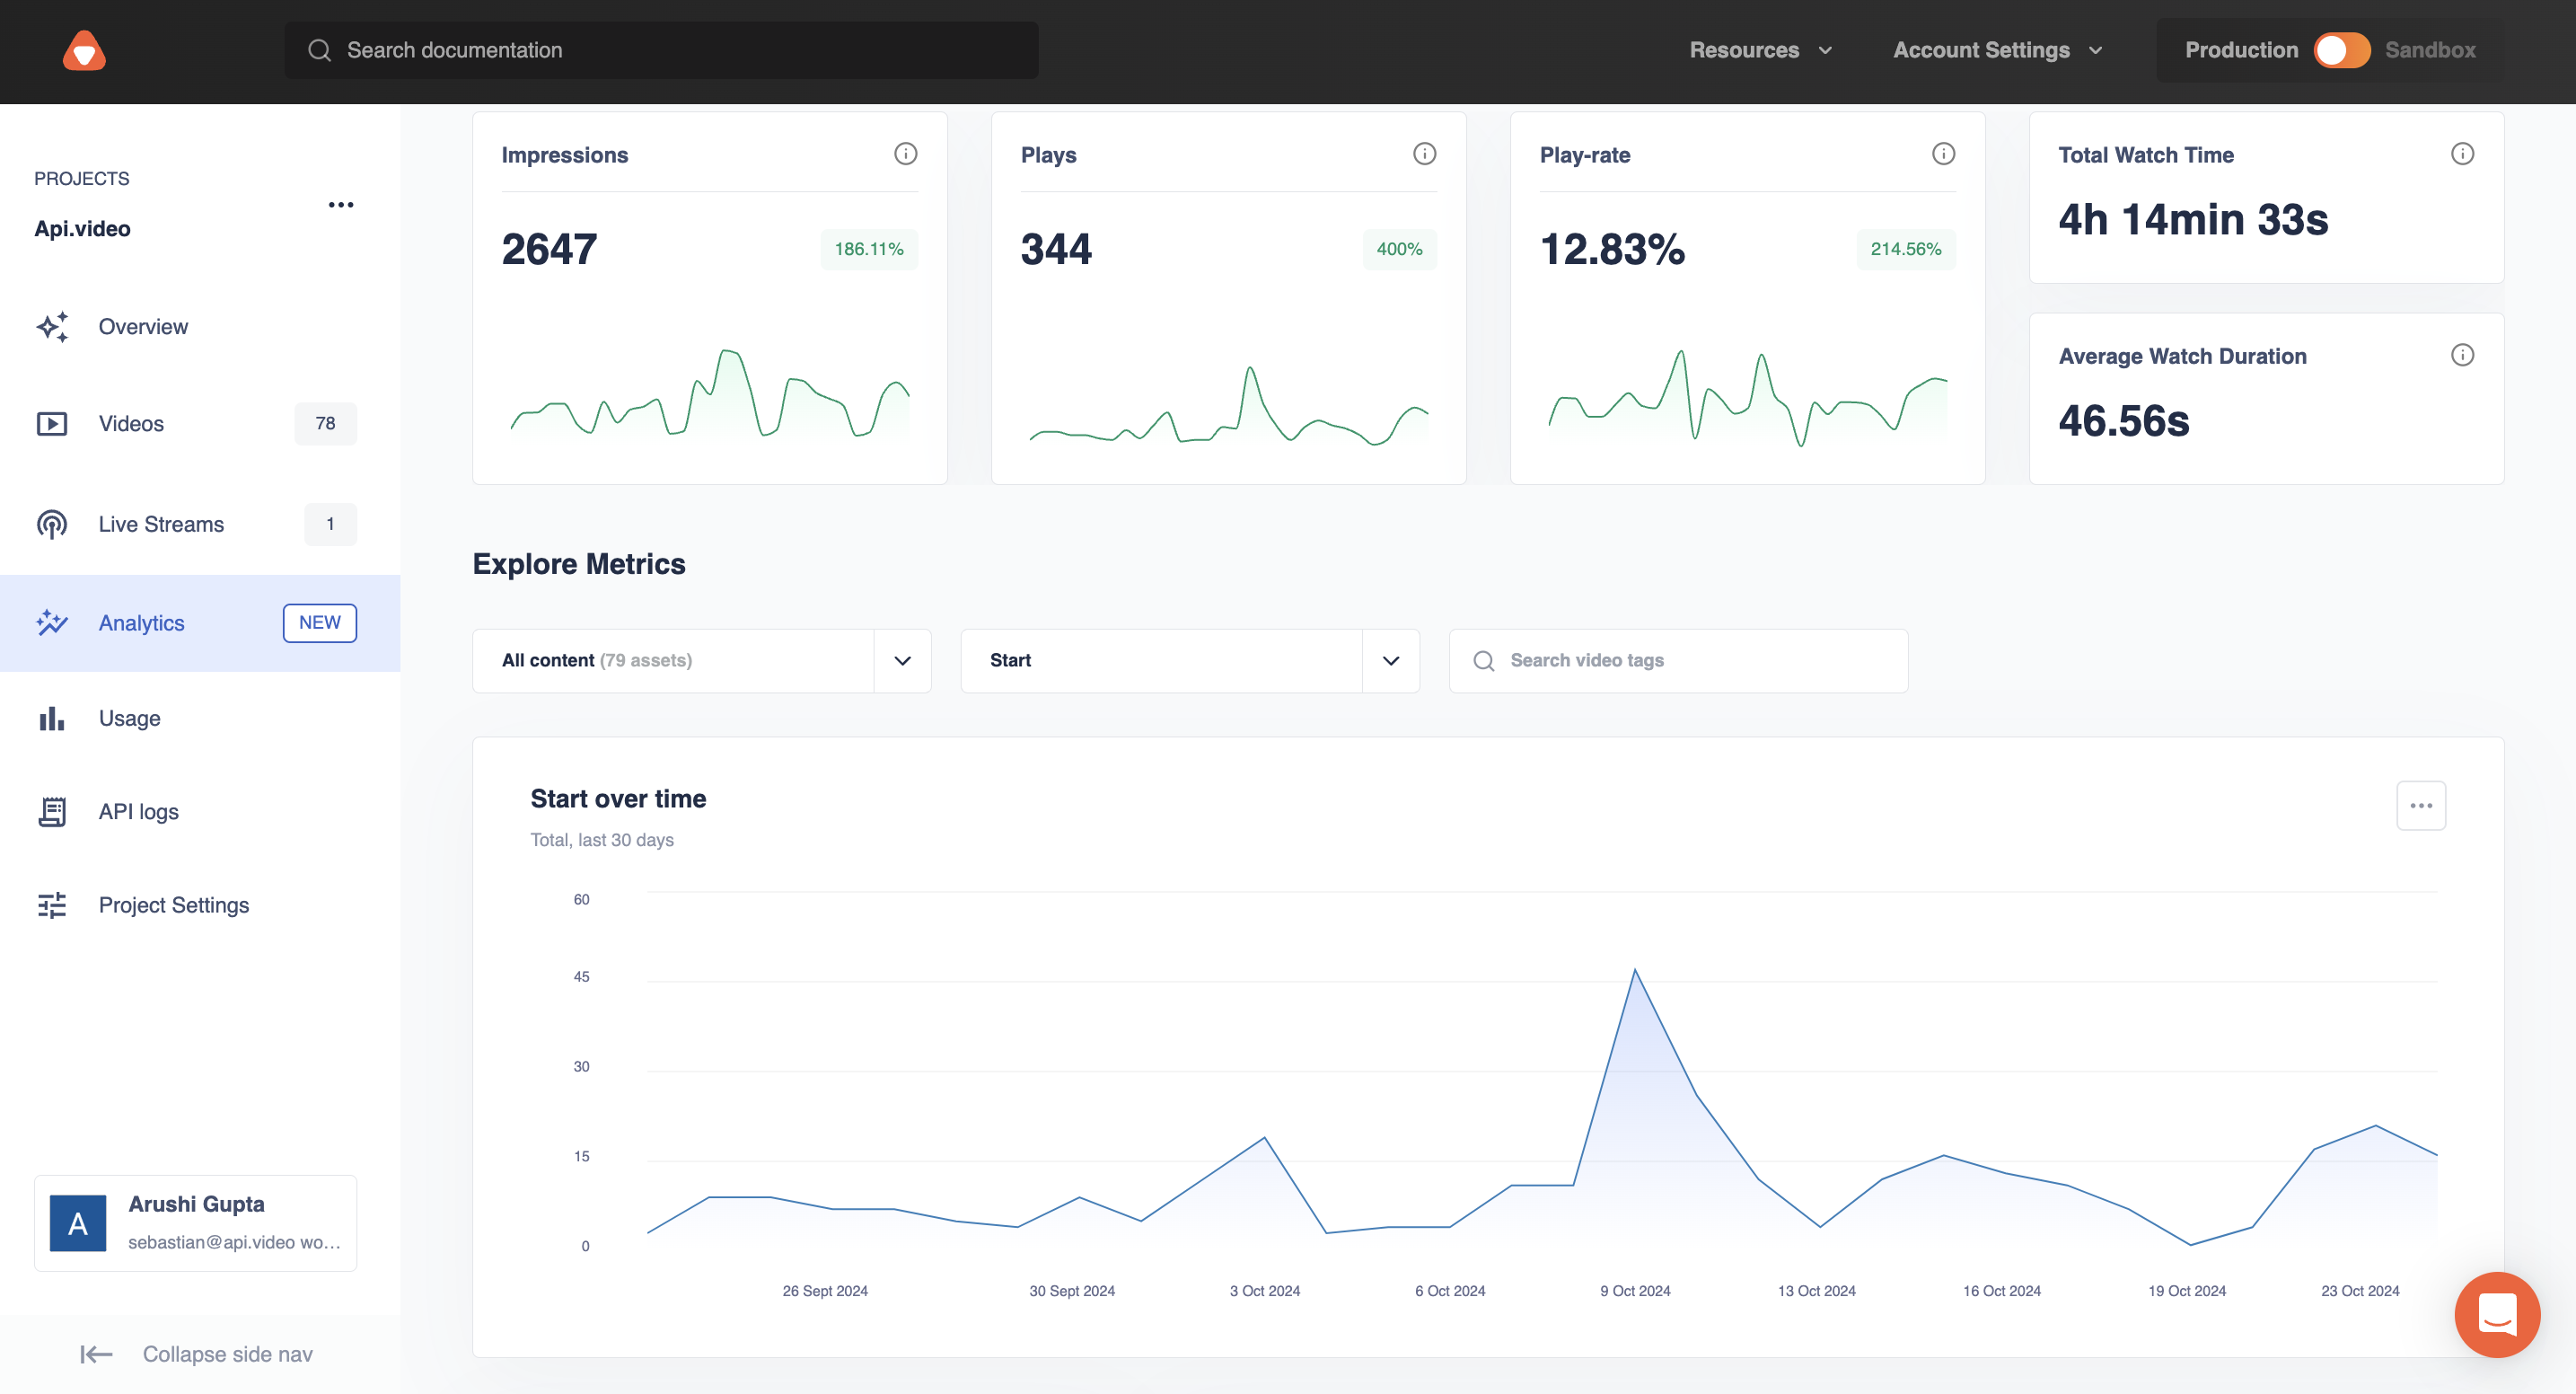
We use the 'start & end' ratio to track the viewer retention of our videos. By seeing how many people started the video, and how many stuck around until the end, we are able to analyse the rate of retention of the videos.


Now how do you measure the start and end ratio of your videos?


By clicking 'Start' as the metric in the dropdown, you can see how many people started a particular video. Then, by choosing 'End' as the metric in the dropdown, you can see how many people watched a particular video till the end.


Now divide both the values and you will get the start & end ratio for your videos. We usually do it on a separate spreadsheet.


Knowing which type of video works best for your audience can help you refine your content strategy to deliver even more value. For longer videos, we recommend using another metric, ‘watch-time’ alongside respective video IDs to get a clearer view of how well your content is being received.

Viewer retention with 'start & end' metrics

Viewer retention with 'start & end' metrics

Leveraging 'tags' for targeted insights

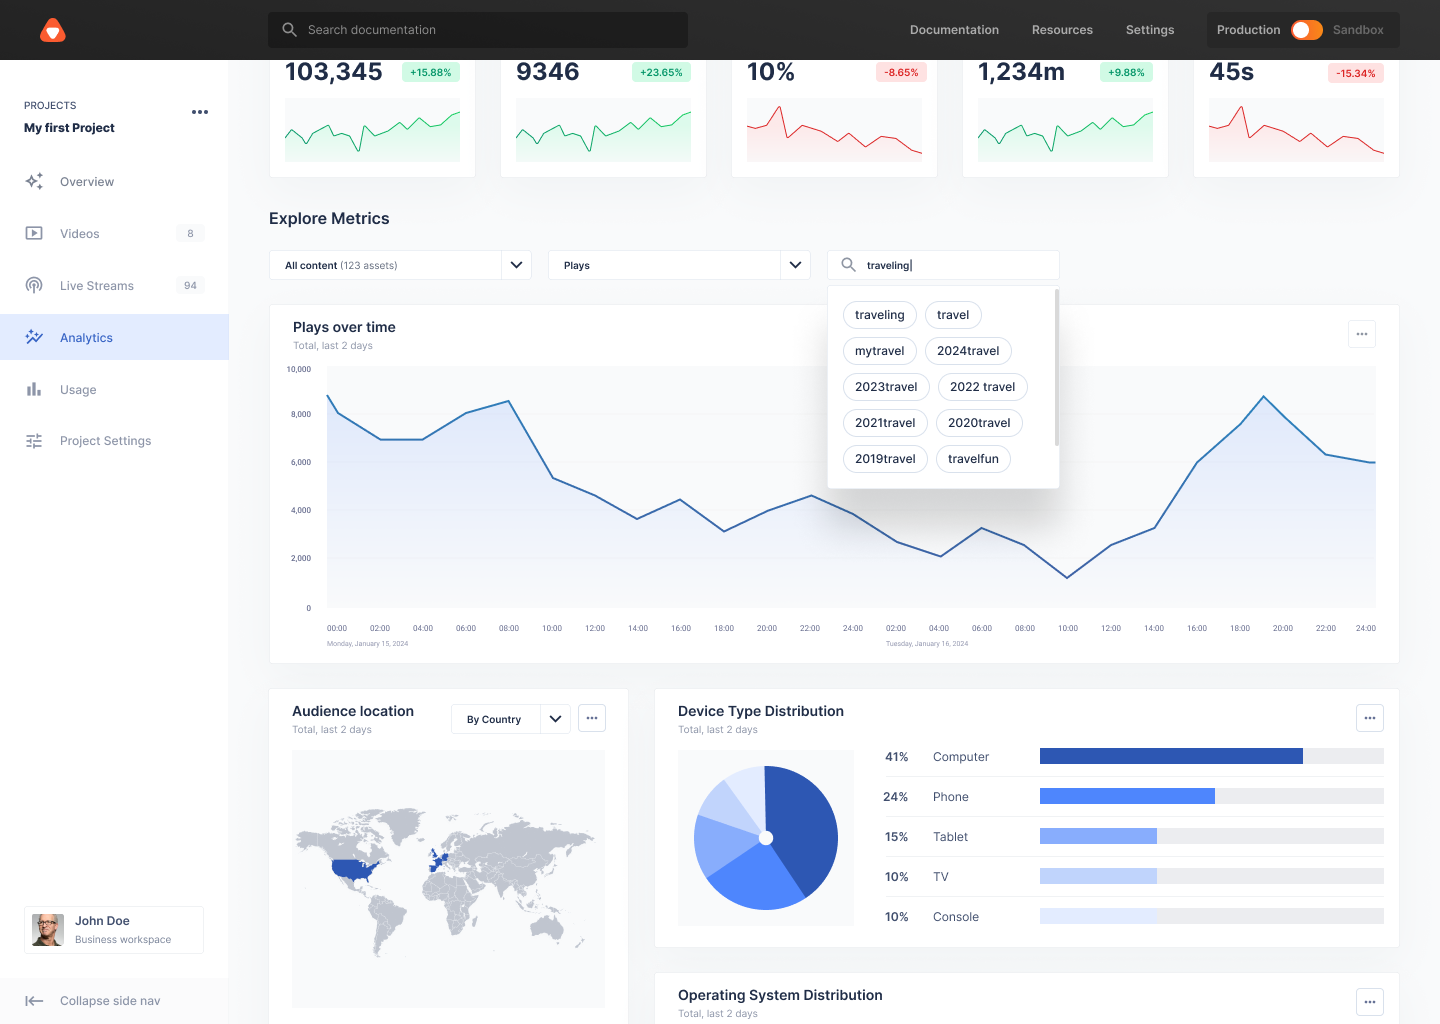
Tags make your life a bit simpler because they help you to filter videos by tags within the dashboard. This gives you a detailed view of specific subsets of content.


For example, we categorize our videos into groups like AI features and customer testimonials. Now, whenever we have to look up the Analytics of a video, we use the respective ‘tag’ and see the numbers behind it. This categorization also helps us identify distinct patterns in viewership based on geographical location, operating systems, or browser types, providing a clearer understanding of our target audience's preferences.

Tags on the Analytics dashboard

Tags on the Analytics dashboard

You can try it too!

And this is not it. There are more metrics on our dashboard to get deeper insights into your videos. With all these metrics at your disposal, you can refine your content, engage your audience more effectively, and make smarter decisions based on solid data.


The features are readily available in the api.video dashboard and accessible through the API for more advanced monitoring. If you want to dive deeper into historical data, consider opting for our extended data retention options of 3 or 12 months. This allows you to get a more comprehensive view of your content's performance over time.


To get started, simply log into your dashboard or check out our documentation to learn more about the relevant Analytics API endpoints.

Try out more than 80 features for free

Access all the features for as long as you need.
No commitment or credit card required

Video API, simplified

Fully customizable API to manage everything video. From encoding to delivery, in minutes.

Built for Speed

The fastest video encoding platform. Serve your users globally with 140+ points of presence. 

Let end-users upload videos

Finally, an API that allows your end-users to upload videos and start live streams in a few clicks.

Affordable

Volume discounts and usage-based pricing to ensure you don’t exceed your budget.