Analytics
LATEST ARTICLES
Tutorials · 5 min read
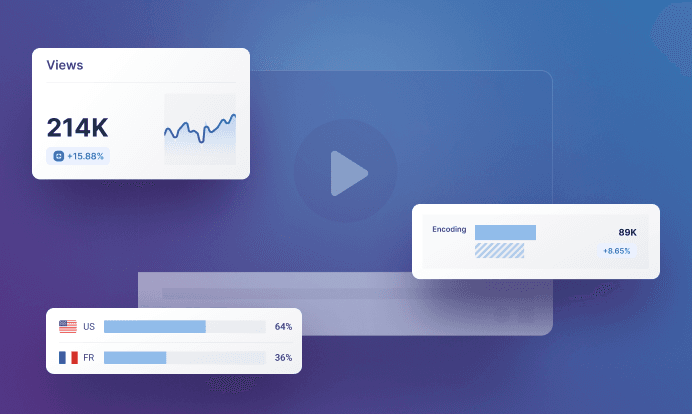
Leverage api.video’s Analytics to enhance your content strategy
Take a look at the two methods you can use to retrieve data for your videos and live streams with Analytics.
api.video · November 23, 2023
Tutorials · 6 min read
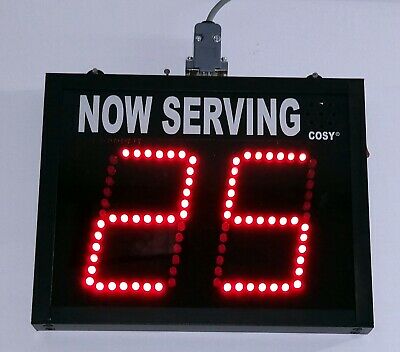
Count your live stream viewers with api.video
When you're live streaming - you want your viewers to know how many others are watching. This demo shows you how to build a counter for your live stream!
Doug Sillars · July 22, 2021
Tutorials · 6 min read
Build a self guided training course with api.video
When building a video training course, you may wish to guide users through the content by unlocking videos only after certain content has been viewed. In this post, we'll walk through how to build such a flow with api.video and our session analytics.
Doug Sillars · June 28, 2021
Tutorials · 8 min read
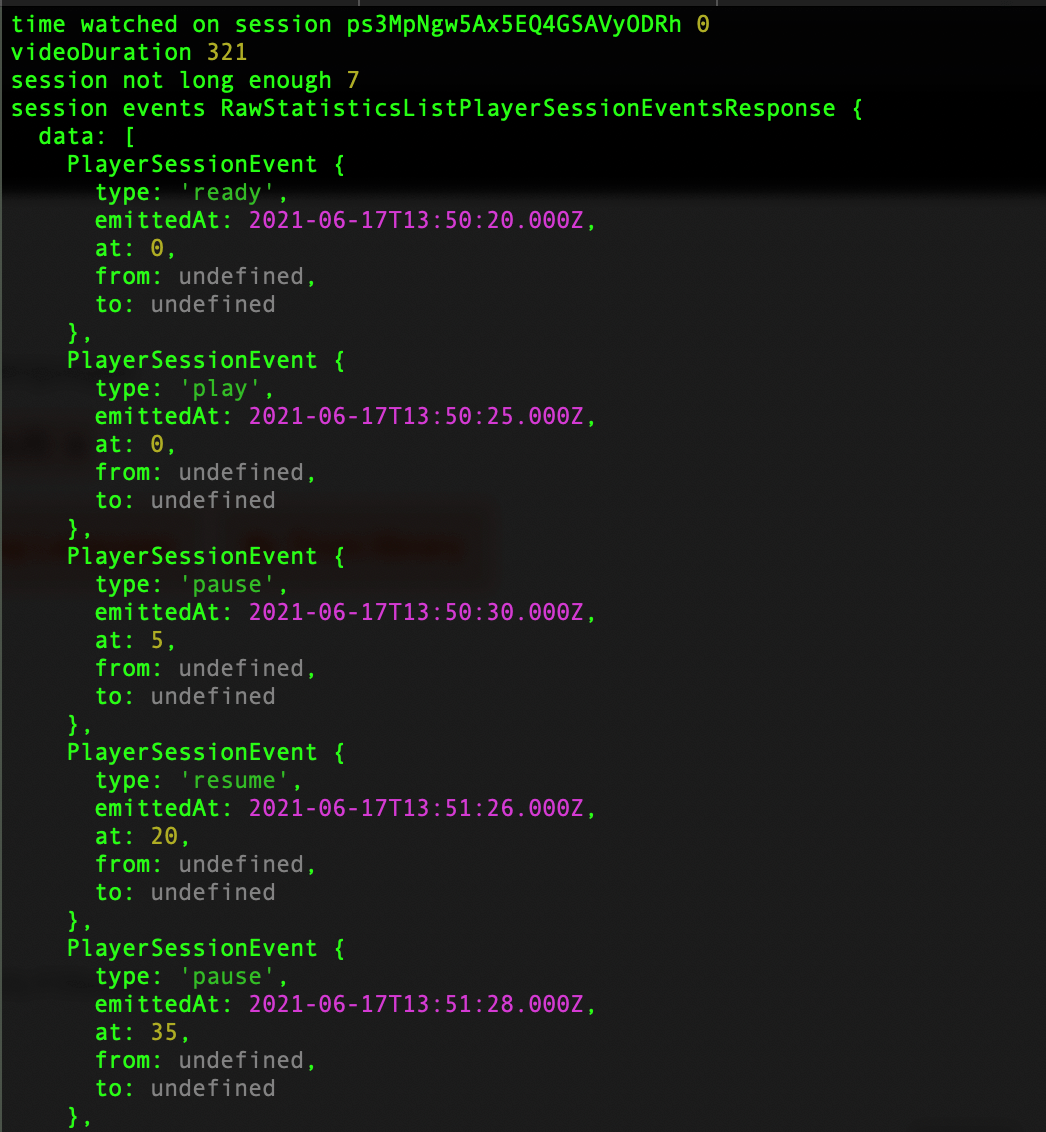
Video event analysis using api.video sessions
Have you ever wondered *how much* of a video has been watched? IN this tutorial, we'll analyze the session events to determine if a video was fully watched or not.
Doug Sillars · June 21, 2021

Tutorials · 13 min read
Using analytics to analyze where to edit a video
Learn how to use some simple pandas commands and analytics visualization tools to figure out where a video could be edited or improved upon.
Erikka Innes · April 19, 2021
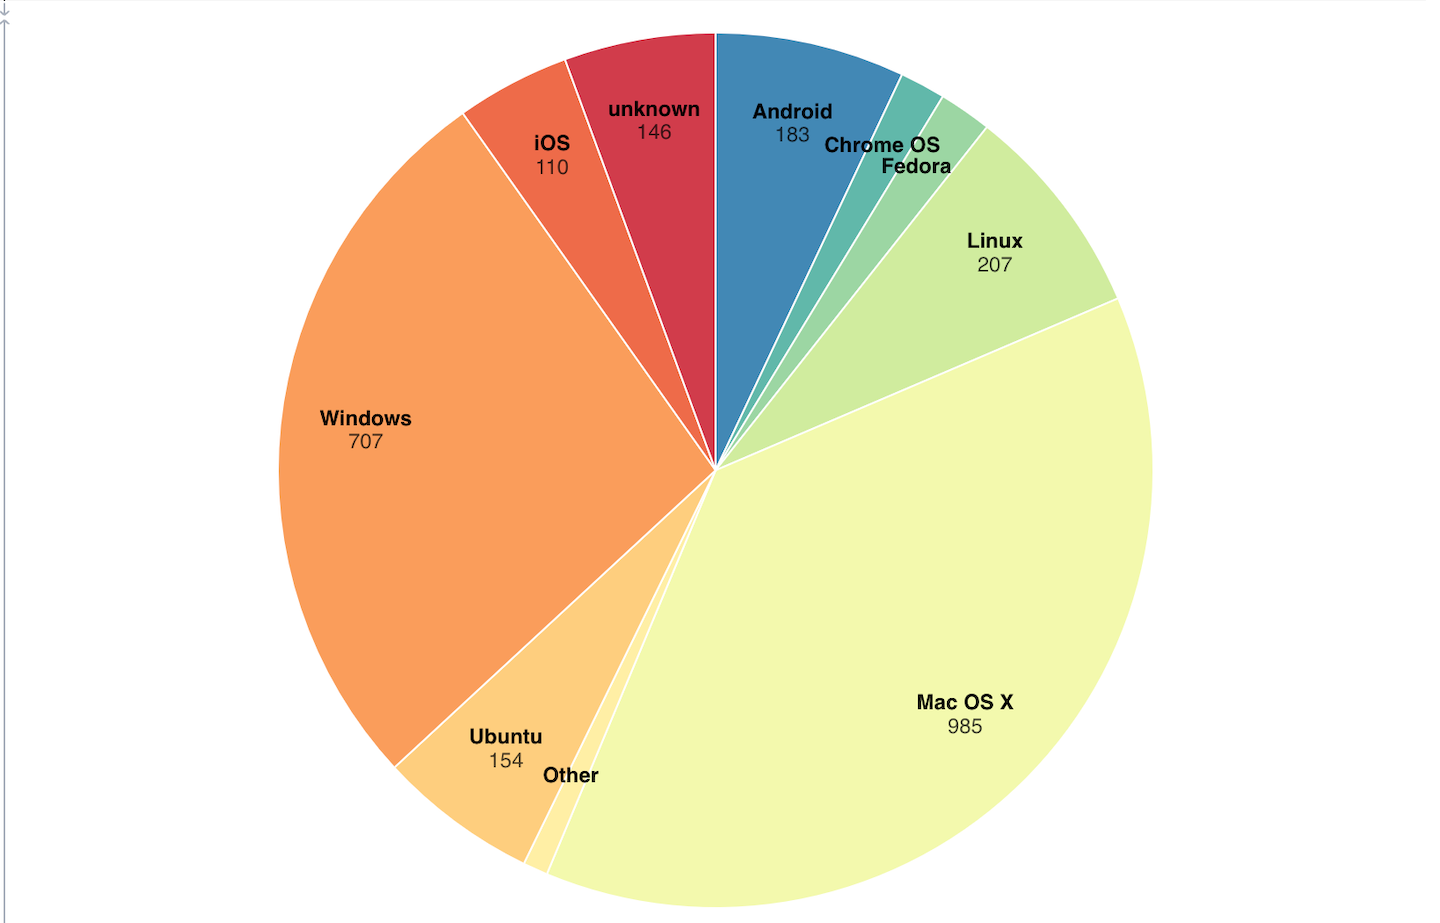
Tutorials · 3 min read
api.video Analytics: Create a pie chart showing what operating system is most popular to view
Using D3, Observable, and Python, we'll create a pie chart showing what operating system is most popular to view video content with.
Erikka Innes · April 12, 2021
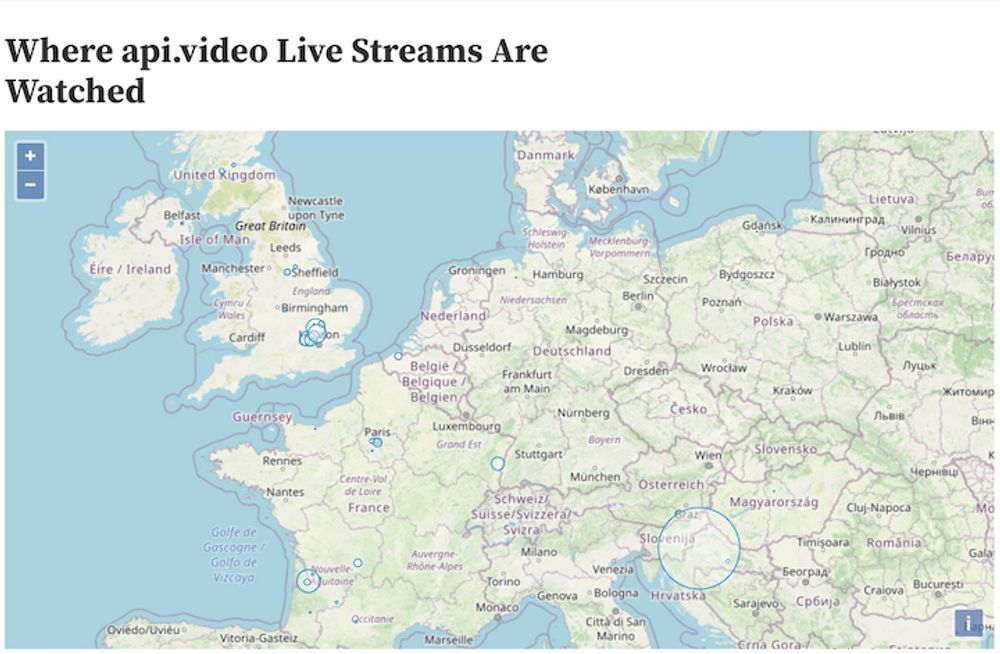
Tutorials · 6 min read
Api.video Analytics: Add markers representing viewer density per city to a map with Observable
Learn how to add a circle representing live stream viewership per city on a map using api.video, Open Layers, and Observable.
Erikka Innes · April 11, 2021
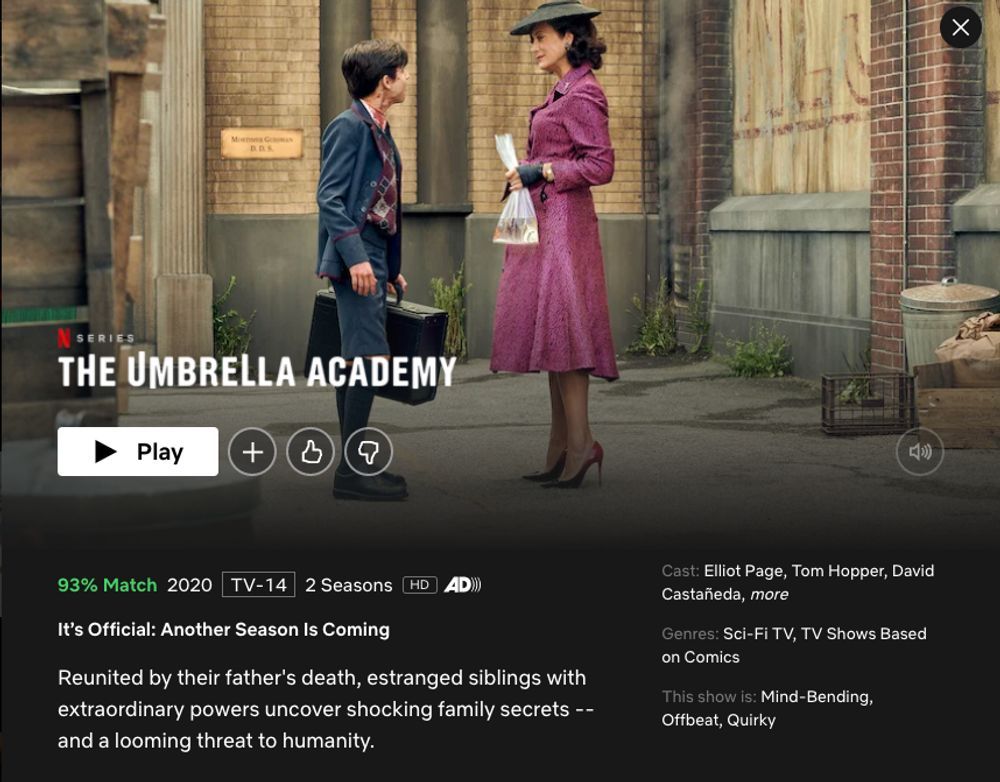
Video trends · 5 min read
How to be like Netflix with the power of api.video Analytics
Netflix has an incredible content recommendation system. Learn a little bit about what goes into how they make their recommendations, then browse api.video's analytics data tutorials.
Erikka Innes · April 10, 2021
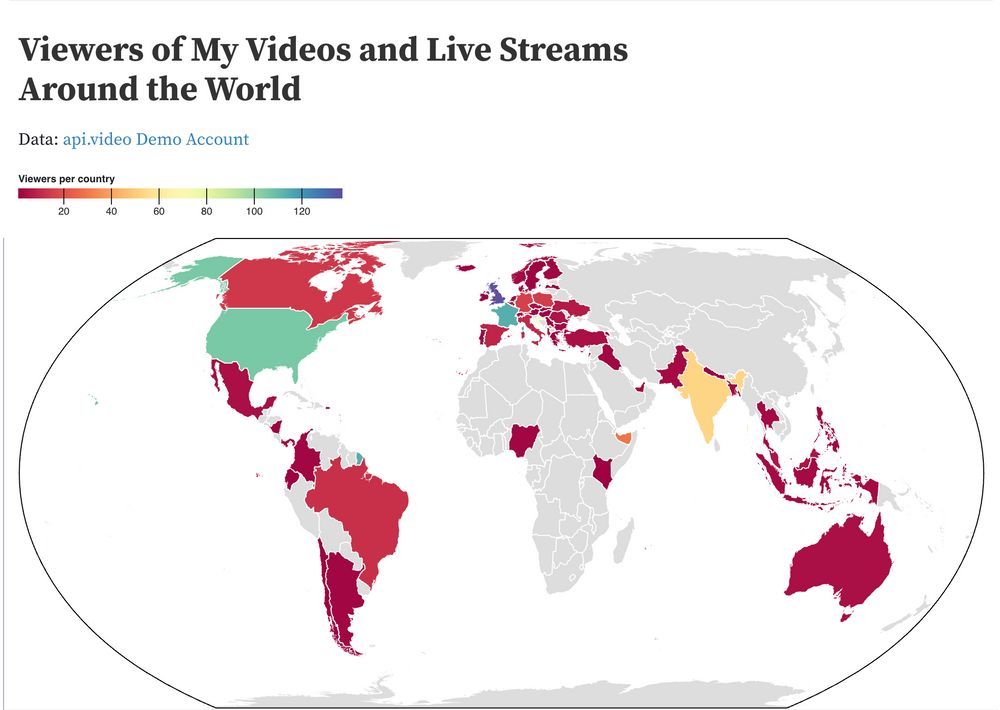
Tutorials · 6 min read
Api.video Analytics: Build a Choropleth Map (and find out what one is)
Build a choropleth showing viewer density by country with Python and Observable!
Erikka Innes · April 8, 2021

Product updates · 3 min read
New feature: Analytics libraries for 3rd party video players!
We've launched libraries for your favourite video players, allowing you to add api.video's analytics into your 3rd party player!
Doug Sillars · April 1, 2021